Example: Charts with Data Tools#
A demo of an various Excel chart data tools that are available via an XlsxWriter chart. These include, Trendlines, Data Labels, Error Bars, Drop Lines, High-Low Lines and Up-Down Bars.
Chart 1 in the following example is a chart with trendlines:
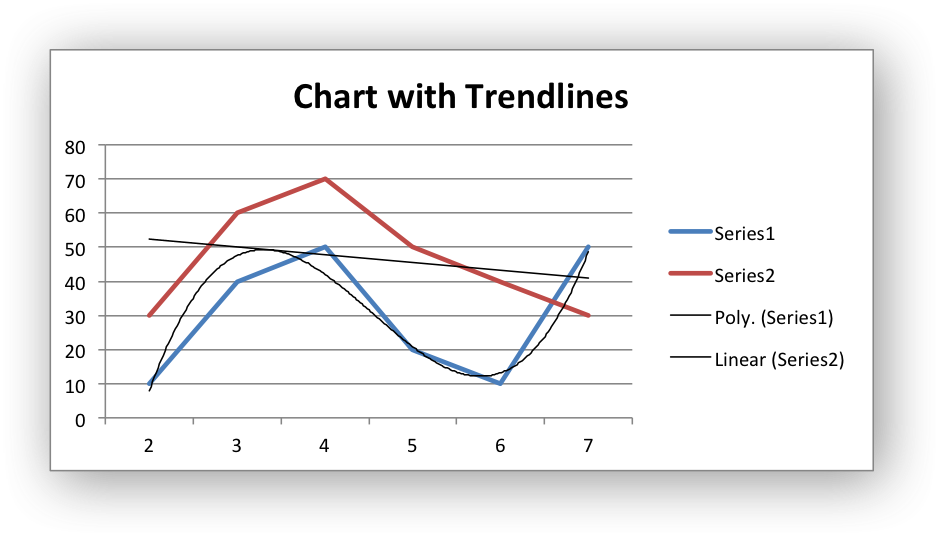
Chart 2 is a chart with data labels and markers:
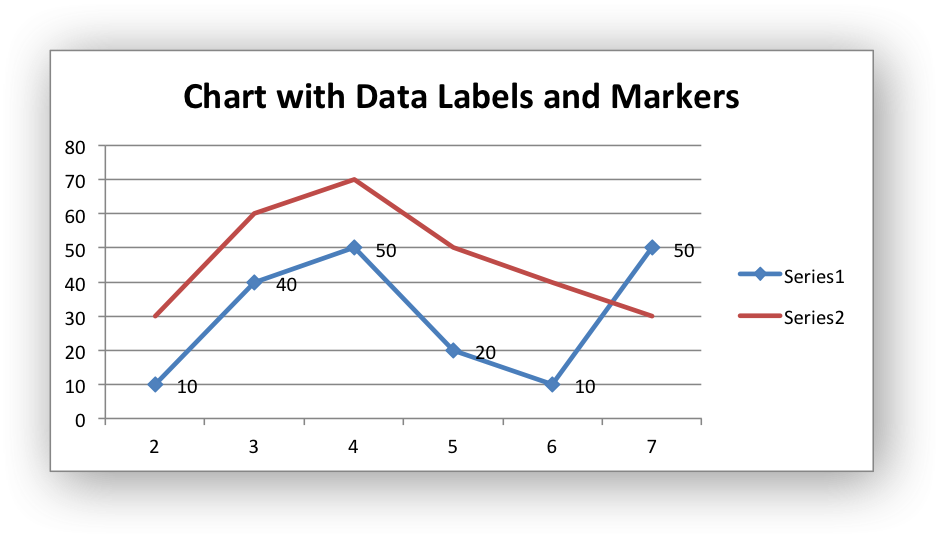
Chart 3 is a chart with error bars:
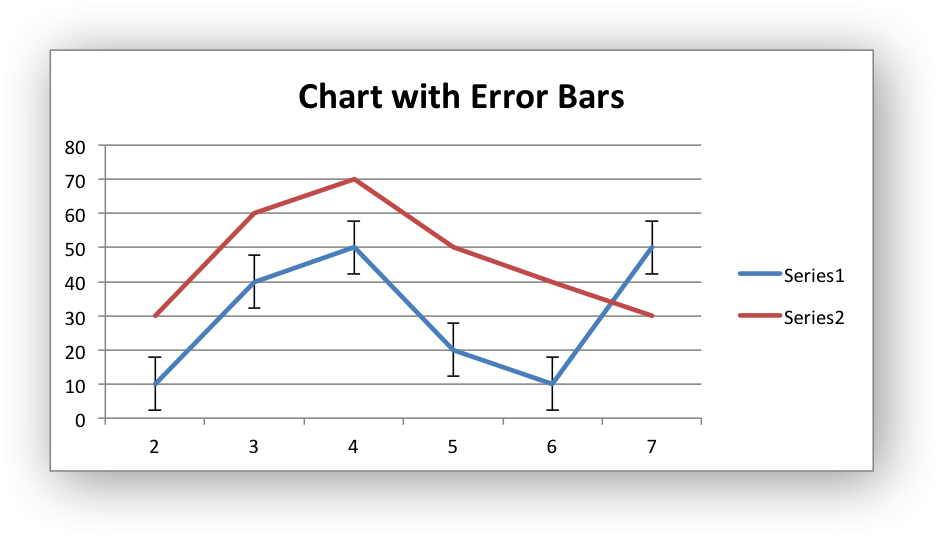
Chart 4 is a chart with up-down bars:
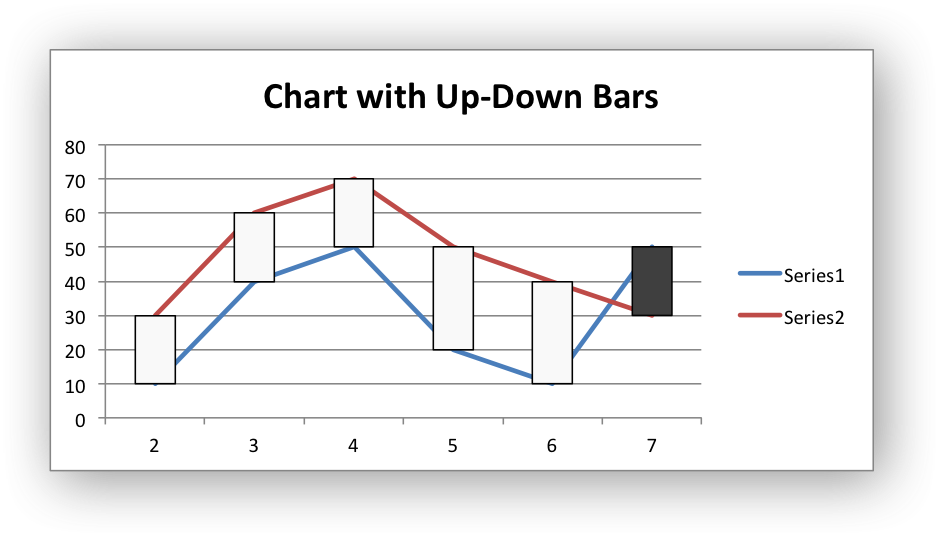
Chart 5 is a chart with hi-low lines:
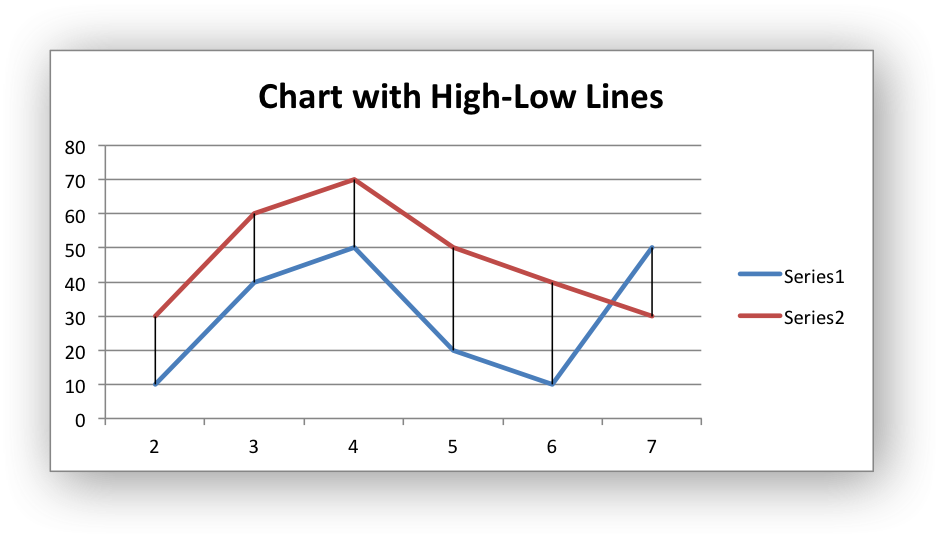
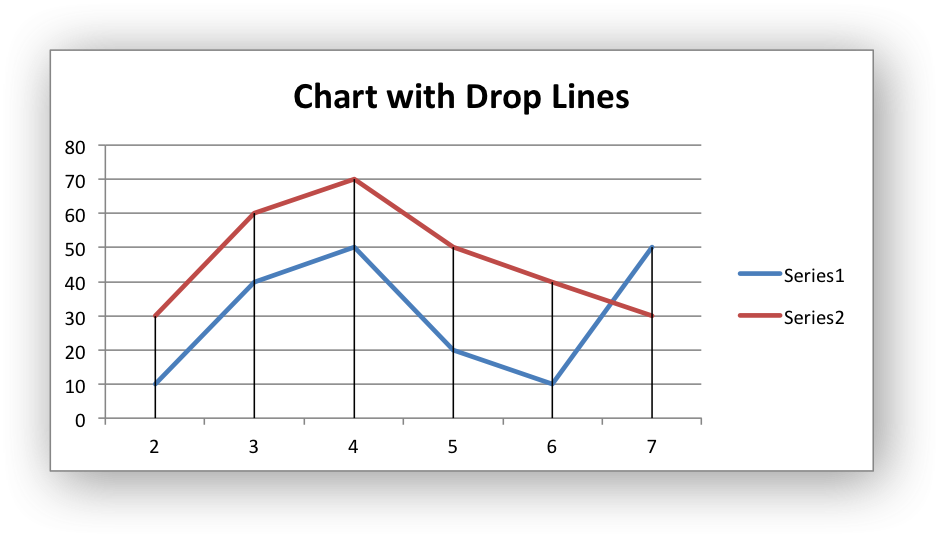
Chart 6 is a chart with drop lines:
#######################################################################
#
# A demo of an various Excel chart data tools that are available via
# an XlsxWriter chart.
#
# These include, Trendlines, Data Labels, Error Bars, Drop Lines,
# High-Low Lines and Up-Down Bars.
#
# SPDX-License-Identifier: BSD-2-Clause
# Copyright 2013-2024, John McNamara, jmcnamara@cpan.org
#
import xlsxwriter

workbook = xlsxwriter.Workbook("chart_data_tools.xlsx")
worksheet = workbook.add_worksheet()
bold = workbook.add_format({"bold": 1})

# Add the worksheet data that the charts will refer to.
headings = ["Number", "Data 1", "Data 2"]
data = [
    [2, 3, 4, 5, 6, 7],
    [10, 40, 50, 20, 10, 50],
    [30, 60, 70, 50, 40, 30],
]

worksheet.write_row("A1", headings, bold)
worksheet.write_column("A2", data[0])
worksheet.write_column("B2", data[1])
worksheet.write_column("C2", data[2])


#######################################################################
#
# Trendline example.
#
# Create a Line chart.
chart1 = workbook.add_chart({"type": "line"})

# Configure the first series with a polynomial trendline.
chart1.add_series(
    {
        "categories": "=Sheet1!$A$2:$A$7",
        "values": "=Sheet1!$B$2:$B$7",
        "trendline": {
            "type": "polynomial",
            "order": 3,
        },
    }
)

# Configure the second series with a moving average trendline.
chart1.add_series(
    {
        "categories": "=Sheet1!$A$2:$A$7",
        "values": "=Sheet1!$C$2:$C$7",
        "trendline": {"type": "linear"},
    }
)

# Add a chart title.
chart1.set_title({"name": "Chart with Trendlines"})

# Insert the chart into the worksheet (with an offset).
worksheet.insert_chart("D2", chart1, {"x_offset": 25, "y_offset": 10})

#######################################################################
#
# Data Labels and Markers example.
#
# Create a Line chart.
chart2 = workbook.add_chart({"type": "line"})

# Configure the first series.
chart2.add_series(
    {
        "categories": "=Sheet1!$A$2:$A$7",
        "values": "=Sheet1!$B$2:$B$7",
        "data_labels": {"value": 1},
        "marker": {"type": "automatic"},
    }
)

# Configure the second series.
chart2.add_series(
    {
        "categories": "=Sheet1!$A$2:$A$7",
        "values": "=Sheet1!$C$2:$C$7",
    }
)

# Add a chart title.
chart2.set_title({"name": "Chart with Data Labels and Markers"})

# Insert the chart into the worksheet (with an offset).
worksheet.insert_chart("D18", chart2, {"x_offset": 25, "y_offset": 10})

#######################################################################
#
# Error Bars example.
#
# Create a Line chart.
chart3 = workbook.add_chart({"type": "line"})

# Configure the first series.
chart3.add_series(
    {
        "categories": "=Sheet1!$A$2:$A$7",
        "values": "=Sheet1!$B$2:$B$7",
        "y_error_bars": {"type": "standard_error"},
    }
)

# Configure the second series.
chart3.add_series(
    {
        "categories": "=Sheet1!$A$2:$A$7",
        "values": "=Sheet1!$C$2:$C$7",
    }
)

# Add a chart title.
chart3.set_title({"name": "Chart with Error Bars"})

# Insert the chart into the worksheet (with an offset).
worksheet.insert_chart("D34", chart3, {"x_offset": 25, "y_offset": 10})

#######################################################################
#
# Up-Down Bars example.
#
# Create a Line chart.
chart4 = workbook.add_chart({"type": "line"})

# Add the Up-Down Bars.
chart4.set_up_down_bars()

# Configure the first series.
chart4.add_series(
    {
        "categories": "=Sheet1!$A$2:$A$7",
        "values": "=Sheet1!$B$2:$B$7",
    }
)

# Configure the second series.
chart4.add_series(
    {
        "categories": "=Sheet1!$A$2:$A$7",
        "values": "=Sheet1!$C$2:$C$7",
    }
)

# Add a chart title.
chart4.set_title({"name": "Chart with Up-Down Bars"})

# Insert the chart into the worksheet (with an offset).
worksheet.insert_chart("D50", chart4, {"x_offset": 25, "y_offset": 10})

#######################################################################
#
# High-Low Lines example.
#
# Create a Line chart.
chart5 = workbook.add_chart({"type": "line"})

# Add the High-Low lines.
chart5.set_high_low_lines()

# Configure the first series.
chart5.add_series(
    {
        "categories": "=Sheet1!$A$2:$A$7",
        "values": "=Sheet1!$B$2:$B$7",
    }
)

# Configure the second series.
chart5.add_series(
    {
        "categories": "=Sheet1!$A$2:$A$7",
        "values": "=Sheet1!$C$2:$C$7",
    }
)

# Add a chart title.
chart5.set_title({"name": "Chart with High-Low Lines"})

# Insert the chart into the worksheet (with an offset).
worksheet.insert_chart("D66", chart5, {"x_offset": 25, "y_offset": 10})

#######################################################################
#
# Drop Lines example.
#
# Create a Line chart.
chart6 = workbook.add_chart({"type": "line"})

# Add Drop Lines.
chart6.set_drop_lines()

# Configure the first series.
chart6.add_series(
    {
        "categories": "=Sheet1!$A$2:$A$7",
        "values": "=Sheet1!$B$2:$B$7",
    }
)

# Configure the second series.
chart6.add_series(
    {
        "categories": "=Sheet1!$A$2:$A$7",
        "values": "=Sheet1!$C$2:$C$7",
    }
)

# Add a chart title.
chart6.set_title({"name": "Chart with Drop Lines"})

# Insert the chart into the worksheet (with an offset).
worksheet.insert_chart("D82", chart6, {"x_offset": 25, "y_offset": 10})

workbook.close()