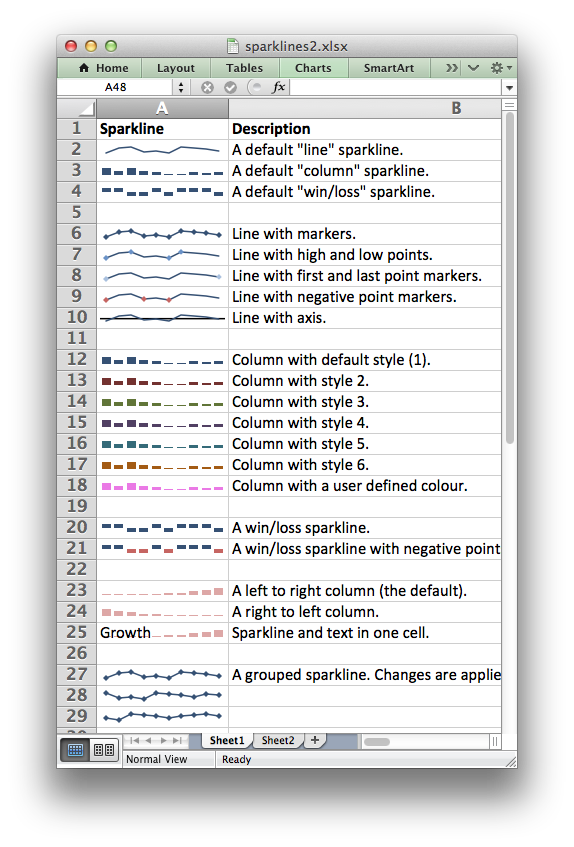
Example: Sparklines (Advanced)#
This example shows the majority of options that can be applied to sparklines.
Sparklines are small charts that fit in a single cell and are used to show trends in data.
See the Working with Sparklines method for more details.
###############################################################################
#
# Example of how to add sparklines to an XlsxWriter file with Python.
#
# Sparklines are small charts that fit in a single cell and are
# used to show trends in data. This example shows the majority of
# options that can be applied to sparklines.
#
# SPDX-License-Identifier: BSD-2-Clause
# Copyright 2013-2024, John McNamara, jmcnamara@cpan.org
#
import xlsxwriter

workbook = xlsxwriter.Workbook("sparklines2.xlsx")
worksheet1 = workbook.add_worksheet()
worksheet2 = workbook.add_worksheet()
bold = workbook.add_format({"bold": True})
row = 1

# Set the columns widths to make the output clearer.
worksheet1.set_column("A:A", 14)
worksheet1.set_column("B:B", 50)
worksheet1.set_zoom(150)

# Headings.
worksheet1.write("A1", "Sparkline", bold)
worksheet1.write("B1", "Description", bold)


###############################################################################
#
text = 'A default "line" sparkline.'

worksheet1.add_sparkline("A2", {"range": "Sheet2!A1:J1"})

worksheet1.write(row, 1, text)
row += 1


###############################################################################
#
text = 'A default "column" sparkline.'

worksheet1.add_sparkline("A3", {"range": "Sheet2!A2:J2", "type": "column"})

worksheet1.write(row, 1, text)
row += 1


###############################################################################
#
text = 'A default "win/loss" sparkline.'

worksheet1.add_sparkline("A4", {"range": "Sheet2!A3:J3", "type": "win_loss"})

worksheet1.write(row, 1, text)
row += 2


###############################################################################
#
text = "Line with markers."

worksheet1.add_sparkline("A6", {"range": "Sheet2!A1:J1", "markers": True})

worksheet1.write(row, 1, text)
row += 1


###############################################################################
#
text = "Line with high and low points."

worksheet1.add_sparkline(
    "A7", {"range": "Sheet2!A1:J1", "high_point": True, "low_point": True}
)

worksheet1.write(row, 1, text)
row += 1


###############################################################################
#
text = "Line with first and last point markers."

worksheet1.add_sparkline(
    "A8", {"range": "Sheet2!A1:J1", "first_point": True, "last_point": True}
)

worksheet1.write(row, 1, text)
row += 1


###############################################################################
#
text = "Line with negative point markers."

worksheet1.add_sparkline("A9", {"range": "Sheet2!A1:J1", "negative_points": True})

worksheet1.write(row, 1, text)
row += 1


###############################################################################
#
text = "Line with axis."

worksheet1.add_sparkline("A10", {"range": "Sheet2!A1:J1", "axis": True})

worksheet1.write(row, 1, text)
row += 2


###############################################################################
#
text = "Column with default style (1)."

worksheet1.add_sparkline("A12", {"range": "Sheet2!A2:J2", "type": "column"})

worksheet1.write(row, 1, text)
row += 1


###############################################################################
#
text = "Column with style 2."

worksheet1.add_sparkline("A13", {"range": "Sheet2!A2:J2", "type": "column", "style": 2})

worksheet1.write(row, 1, text)
row += 1


###############################################################################
#
text = "Column with style 3."

worksheet1.add_sparkline("A14", {"range": "Sheet2!A2:J2", "type": "column", "style": 3})

worksheet1.write(row, 1, text)
row += 1


###############################################################################
#
text = "Column with style 4."

worksheet1.add_sparkline("A15", {"range": "Sheet2!A2:J2", "type": "column", "style": 4})

worksheet1.write(row, 1, text)
row += 1


###############################################################################
#
text = "Column with style 5."

worksheet1.add_sparkline("A16", {"range": "Sheet2!A2:J2", "type": "column", "style": 5})

worksheet1.write(row, 1, text)
row += 1


###############################################################################
#
text = "Column with style 6."

worksheet1.add_sparkline("A17", {"range": "Sheet2!A2:J2", "type": "column", "style": 6})

worksheet1.write(row, 1, text)
row += 1


###############################################################################
#
text = "Column with a user defined color."

worksheet1.add_sparkline(
    "A18", {"range": "Sheet2!A2:J2", "type": "column", "series_color": "#E965E0"}
)

worksheet1.write(row, 1, text)
row += 2


###############################################################################
#
text = "A win/loss sparkline."

worksheet1.add_sparkline("A20", {"range": "Sheet2!A3:J3", "type": "win_loss"})

worksheet1.write(row, 1, text)
row += 1


###############################################################################
#
text = "A win/loss sparkline with negative points highlighted."

worksheet1.add_sparkline(
    "A21", {"range": "Sheet2!A3:J3", "type": "win_loss", "negative_points": True}
)

worksheet1.write(row, 1, text)
row += 2


###############################################################################
#
text = "A left to right column (the default)."

worksheet1.add_sparkline(
    "A23", {"range": "Sheet2!A4:J4", "type": "column", "style": 20}
)

worksheet1.write(row, 1, text)
row += 1


###############################################################################
#
text = "A right to left column."

worksheet1.add_sparkline(
    "A24", {"range": "Sheet2!A4:J4", "type": "column", "style": 20, "reverse": True}
)

worksheet1.write(row, 1, text)
row += 1


###############################################################################
#
text = "Sparkline and text in one cell."

worksheet1.add_sparkline(
    "A25", {"range": "Sheet2!A4:J4", "type": "column", "style": 20}
)

worksheet1.write(row, 0, "Growth")
worksheet1.write(row, 1, text)
row += 2


###############################################################################
#
text = "A grouped sparkline. Changes are applied to all three."

worksheet1.add_sparkline(
    "A27",
    {
        "location": ["A27", "A28", "A29"],
        "range": ["Sheet2!A5:J5", "Sheet2!A6:J6", "Sheet2!A7:J7"],
        "markers": True,
    },
)

worksheet1.write(row, 1, text)
row += 1


###############################################################################
#
# Create a second worksheet with data to plot.
#
worksheet2.set_column("A:J", 11)

data = [
    # Simple line data.
    [-2, 2, 3, -1, 0, -2, 3, 2, 1, 0],
    # Simple column data.
    [30, 20, 33, 20, 15, 5, 5, 15, 10, 15],
    # Simple win/loss data.
    [1, 1, -1, -1, 1, -1, 1, 1, 1, -1],
    # Unbalanced histogram.
    [5, 6, 7, 10, 15, 20, 30, 50, 70, 100],
    # Data for the grouped sparkline example.
    [-2, 2, 3, -1, 0, -2, 3, 2, 1, 0],
    [3, -1, 0, -2, 3, 2, 1, 0, 2, 1],
    [0, -2, 3, 2, 1, 0, 1, 2, 3, 1],
]

# Write the sample data to the worksheet.
worksheet2.write_row("A1", data[0])
worksheet2.write_row("A2", data[1])
worksheet2.write_row("A3", data[2])
worksheet2.write_row("A4", data[3])
worksheet2.write_row("A5", data[4])
worksheet2.write_row("A6", data[5])
worksheet2.write_row("A7", data[6])

workbook.close()