Working with Autofilters#
An autofilter in Excel is a way of filtering a 2D range of data based on some simple criteria.
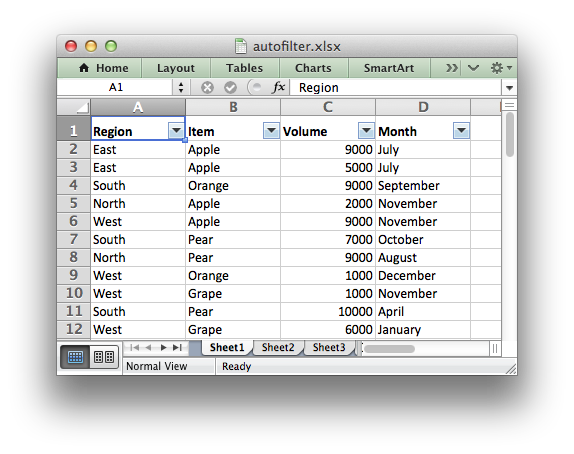
Applying an autofilter#
The first step is to apply an autofilter to a cell range in a worksheet using
the autofilter() method:
worksheet.autofilter('A1:D11')
As usual you can also use Row-Column notation:
worksheet.autofilter(0, 0, 10, 3) # Same as above.
Filter data in an autofilter#
The autofilter() defines the cell range that the filter applies to and
creates drop-down selectors in the heading row. In order to filter out data it
is necessary to apply some criteria to the columns using either the
filter_column() or filter_column_list() methods.
The filter_column method is used to filter columns in a autofilter range
based on simple criteria:
worksheet.filter_column('A', 'x > 2000')
worksheet.filter_column('B', 'x > 2000 and x < 5000')
It isn’t sufficient to just specify the filter condition. You must also hide
any rows that don’t match the filter condition. Rows are hidden using the
set_row() hidden parameter. XlsxWriter cannot filter rows
automatically since this isn’t part of the file format.
The following is an example of how you might filter a data range to match an autofilter criteria:
# Set the autofilter.
worksheet.autofilter('A1:D51')

# Add the filter criteria. The placeholder "Region" in the filter is
# ignored and can be any string that adds clarity to the expression.
worksheet.filter_column(0, 'Region == East')

# Hide the rows that don't match the filter criteria.
row = 1
for row_data in (data):
    region = row_data[0]

    # Check for rows that match the filter.
    if region == 'East':
        # Row matches the filter, display the row as normal.
        pass
    else:
        # We need to hide rows that don't match the filter.
        worksheet.set_row(row, options={'hidden': True})

    worksheet.write_row(row, 0, row_data)

    # Move on to the next worksheet row.
    row += 1
Setting a filter criteria for a column#
The filter_column() method can be used to filter columns in a autofilter
range based on simple conditions:
worksheet.filter_column('A', 'x > 2000')
The column parameter can either be a zero indexed column number or a string
column name.
The following operators are available for setting the filter criteria:
Operator
   ==
   !=
   >
   <
   >=
   <=

   and
   or
An expression can comprise a single statement or two statements separated by
the and and or operators. For example:
'x <  2000'
'x >  2000'
'x == 2000'
'x >  2000 and x <  5000'
'x == 2000 or  x == 5000'
Filtering of blank or non-blank data can be achieved by using a value of
Blanks or NonBlanks in the expression:
'x == Blanks'
'x == NonBlanks'
Excel also allows some simple string matching operations:
'x == b*'      # begins with b
'x != b*'      # doesn't begin with b
'x == *b'      # ends with b
'x != *b'      # doesn't end with b
'x == *b*'     # contains b
'x != *b*'     # doesn't contain b
You can also use '*' to match any character or number and '?' to match
any single character or number. No other regular expression quantifier is
supported by Excel’s filters. Excel’s regular expression characters can be
escaped using '~'.
The placeholder variable x in the above examples can be replaced by any
simple string. The actual placeholder name is ignored internally so the
following are all equivalent:
'x     < 2000'
'col   < 2000'
'Price < 2000'
A filter condition can only be applied to a column in a range specified by the
autofilter() method.
Setting a column list filter#
Prior to Excel 2007 it was only possible to have either 1 or 2 filter
conditions such as the ones shown above in the filter_column() method.
Excel 2007 introduced a new list style filter where it is possible to specify 1 or more ‘or’ style criteria. For example if your column contained data for the months of the year you could filter the data based on certain months:
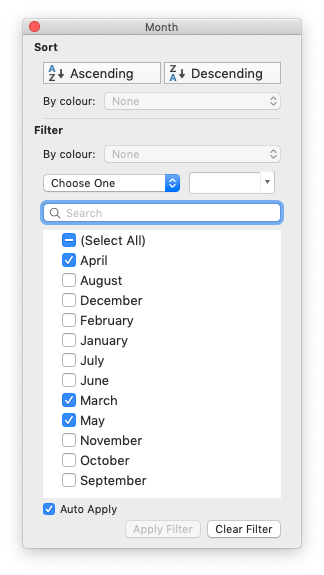
The filter_column_list() method can be used to represent these types of
filters:
worksheet.filter_column_list('A', ['March', 'April', 'May'])
One or more criteria can be selected:
worksheet.filter_column_list('A', ['March'])
worksheet.filter_column_list('B', [100, 110, 120, 130])
To filter blanks as part of the list use Blanks as a list item:
worksheet.filter_column_list('A', ['March', 'April', 'May', 'Blanks'])
As explained above, it isn’t sufficient to just specify filters. You must also hide any rows that don’t match the filter condition.
Example#
See Example: Applying Autofilters for a full example of all these features.