Working with Sparklines#
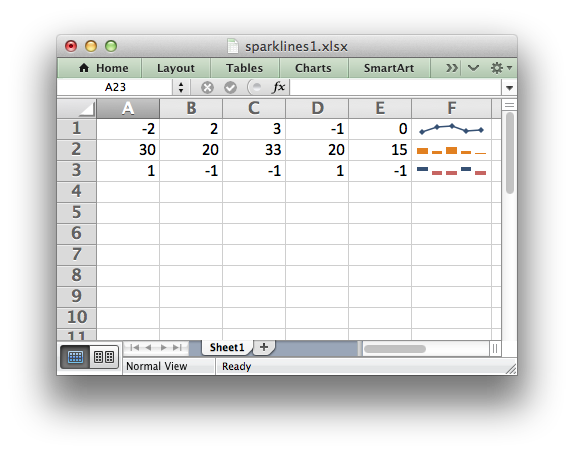
Sparklines are a feature of Excel 2010+ which allows you to add small charts to worksheet cells. These are useful for showing visual trends in data in a compact format.
Sparklines were invented by Edward Tufte: https://en.wikipedia.org/wiki/Sparklines
The add_sparkline() method#
The add_sparkline() worksheet method is used to add sparklines to a cell
or a range of cells:
worksheet.add_sparkline(0, 5, {'range': 'Sheet1!A1:E1'})
Both row-column and A1 style notation are supported. See Working with Cell Notation for more details.
The parameters to add_sparkline() must be passed in a dictionary. The main
sparkline parameters are:
range (required) |
type |
style |
markers |
negative_points |
axis |
reverse |
Other, less commonly used parameters are:
location |
high_point |
low_point |
first_point |
last_point |
max |
min |
empty_cells |
show_hidden |
date_axis |
weight |
series_color |
negative_color |
markers_color |
first_color |
last_color |
high_color |
low_color |
These parameters are explained in the sections below.
Note
Sparklines are a feature of Excel 2010+ only. You can write them to an XLSX file that can be read by Excel 2007 but they won’t be displayed.
range#
The range specifier is the only non-optional parameter.
It specifies the cell data range that the sparkline will plot:
worksheet.add_sparkline('F1', {'range': 'A1:E1'})
The range should be a 2D array. (For 3D arrays of cells see “Grouped
Sparklines” below).
If range is not on the same worksheet you can specify its location using
the usual Excel notation:
worksheet.add_sparkline('F1', {'range': 'Sheet2!A1:E1'})
If the worksheet contains spaces or special characters you should quote the worksheet name in the same way that Excel does:
worksheet.add_sparkline('F1', {'range': "'Monthly Data'!A1:E1"})
type#
Specifies the type of sparkline. There are 3 available sparkline types:
line (default)
column
win_loss
For example:
worksheet.add_sparkline('F2', {'range': 'A2:E2',
                               'type': 'column'})
style#
Excel provides 36 built-in Sparkline styles in 6 groups of 6. The style
parameter can be used to replicate these and should be a corresponding number
from 1 .. 36:
worksheet.add_sparkline('F2', {'range': 'A2:E2',
                               'type': 'column',
                               'style': 12})
The style number starts in the top left of the style grid and runs left to
right. The default style is 1. It is possible to override color elements of
the sparklines using the _color parameters below.
markers#
Turn on the markers for line style sparklines:
worksheet.add_sparkline('A6', {'range': 'Sheet2!A1:J1',
                               'markers': True})
Markers aren’t shown in Excel for column and win_loss sparklines.
negative_points#
Highlight negative values in a sparkline range. This is usually required with
win_loss sparklines:
worksheet.add_sparkline('A9', {'range': 'Sheet2!A1:J1',
                               'negative_points': True})
axis#
Display a horizontal axis in the sparkline:
worksheet.add_sparkline('A10', {'range': 'Sheet2!A1:J1',
                                'axis': True})
reverse#
Plot the data from right-to-left instead of the default left-to-right:
worksheet.add_sparkline('A24', {'range': 'Sheet2!A4:J4',
                                'type': 'column',
                                'style': 20,
                                'reverse': True})
weight#
Adjust the default line weight (thickness) for line style sparklines:
worksheet.add_sparkline('F2', {'range': 'A2:E2',
                               'weight': 0.25})
The weight value should be one of the following values allowed by Excel:
0.25, 0.5, 0.75, 1, 1.25, 2.25, 3, 4.25, 6
high_point, low_point, first_point, last_point#
Highlight points in a sparkline range:
worksheet.add_sparkline('A7', {'range': 'Sheet2!A1:J1',
                               'high_point': True,
                               'low_point': True,
                               'first_point': True})
max, min#
Specify the maximum and minimum vertical axis values:
worksheet.add_sparkline('F1', {'range': 'A1:E1',
                               'max': 0.5,
                               'min': -0.5})
As a special case you can set the maximum and minimum to be for a group of sparklines rather than one:
'max': 'group'
See “Grouped Sparklines” below.
empty_cells#
Define how empty cells are handled in a sparkline:
worksheet.add_sparkline('F1', {'range': 'A1:E1',
                               'empty_cells': 'zero'})
The available options are:
gaps: show empty cells as gaps (the default).zero: plot empty cells as 0.connect: Connect points with a line (“line” type sparklines only).
date_axis#
Specify an alternative date axis for the sparkline. This is useful if the data being plotted isn’t at fixed width intervals:
worksheet.add_sparkline('F3', {'range': 'A3:E3',
                               'date_axis': 'A4:E4'})
The number of cells in the date range should correspond to the number of cells in the data range.
series_color#
It is possible to override the color of a sparkline style using the following parameters:
series_color
negative_color
markers_color
first_color
last_color
high_color
low_color
The color should be specified as a HTML style #rrggbb hex value:
worksheet.add_sparkline('A18', {'range': 'Sheet2!A2:J2',
                                'type': 'column',
                                'series_color': '#E965E0'})
location#
By default the sparkline location is specified by row and col in
add_sparkline(). However, for grouped sparklines it is necessary to
specify more than one cell location. The location parameter is used to
specify a list of cells. See “Grouped Sparklines” below.
Grouped Sparklines#
The add_sparkline() worksheet method can be used multiple times to write as
many sparklines as are required in a worksheet.
However, it is sometimes necessary to group contiguous sparklines so that
changes that are applied to one are applied to all. In Excel this is achieved
by selecting a 3D range of cells for the data range and a 2D range of
cells for the location.
In XlsxWriter, you can simulate this by passing an array refs of values to
location and range:
worksheet.add_sparkline('A27', {'location': ['A27',   'A28',   'A29'],
                                'range':    ['A5:J5', 'A6:J6', 'A7:J7']})
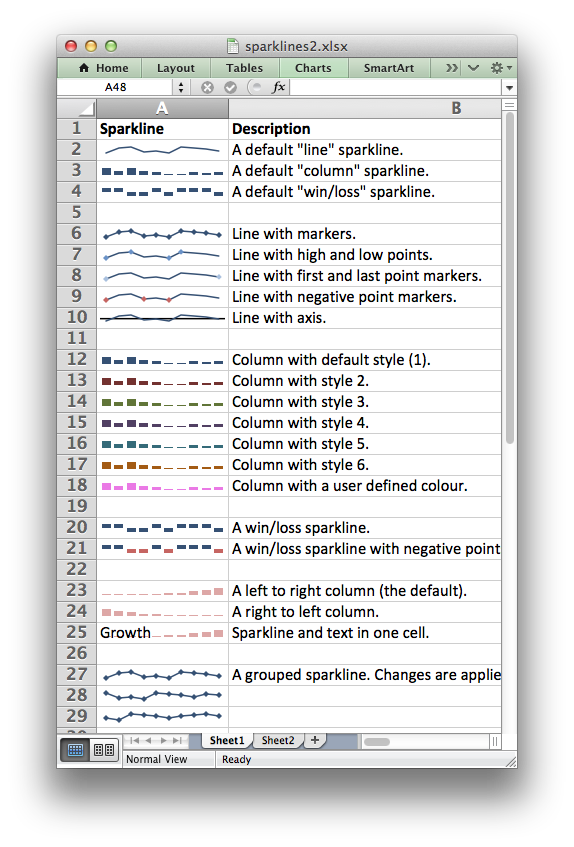
Sparkline examples#
See Example: Sparklines (Simple) and Example: Sparklines (Advanced).