Working with Worksheet Tables#
Tables in Excel are a way of grouping a range of cells into a single entity that has common formatting or that can be referenced from formulas. Tables can have column headers, autofilters, total rows, column formulas and default formatting.
For more information see An Overview of Excel Tables in the Microsoft Office documentation.
Note
Tables aren’t available in XlsxWriter when Workbook()
'constant_memory' mode is enabled.
add_table()#
Tables are added to a worksheet using the add_table() method:
worksheet.add_table('B3:F7', {options})
The data range can be specified in ‘A1’ or ‘Row/Column’ notation (see Working with Cell Notation):
worksheet.add_table('B3:F7')
# Same as:
worksheet.add_table(2, 1, 6, 5)
The options parameter should be a dict containing the parameters that describe the table options and data. The available options are:
data |
autofilter |
header_row |
banded_columns |
banded_rows |
first_column |
last_column |
style |
total_row |
columns |
name |
These options are explained below. There are no required parameters and the options parameter is itself optional if no options are specified (as shown above).
data#
The data parameter can be used to specify the data in the cells of the
table:
data = [
    ['Apples', 10000, 5000, 8000, 6000],
    ['Pears',   2000, 3000, 4000, 5000],
    ['Bananas', 6000, 6000, 6500, 6000],
    ['Oranges',  500,  300,  200,  700],

]

worksheet.add_table('B3:F7', {'data': data})
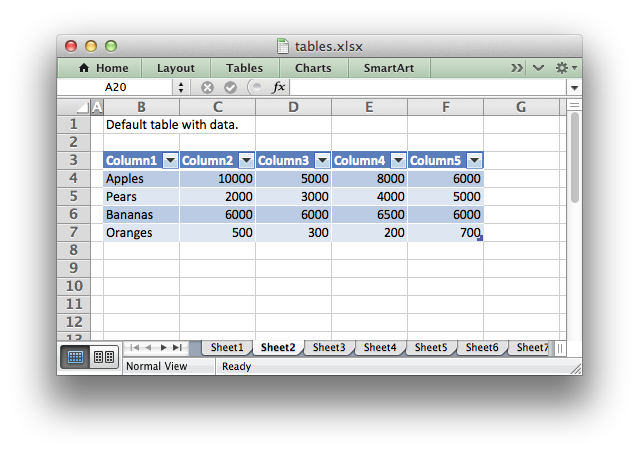
Table data can also be written separately, as an array or individual cells:
# These statements are the same as the single statement above.
worksheet.add_table('B3:F7')
worksheet.write_row('B4', data[0])
worksheet.write_row('B5', data[1])
worksheet.write_row('B6', data[2])
worksheet.write_row('B7', data[3])
Writing the cell data separately is occasionally required when you need to
control the write_() methods used to populate the cells or if you wish to
modify individual cell formatting.
The data structure should be an list of lists holding row data as shown
above.
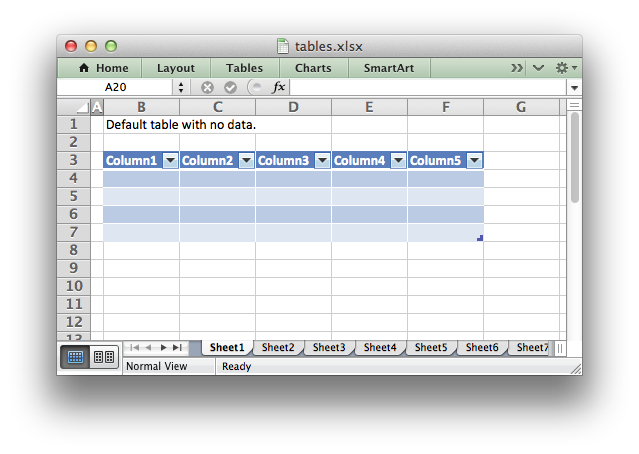
header_row#
The header_row parameter can be used to turn on or off the header row in
the table. It is on by default:
# Turn off the header row.
worksheet.add_table('B4:F7', {'header_row': False})
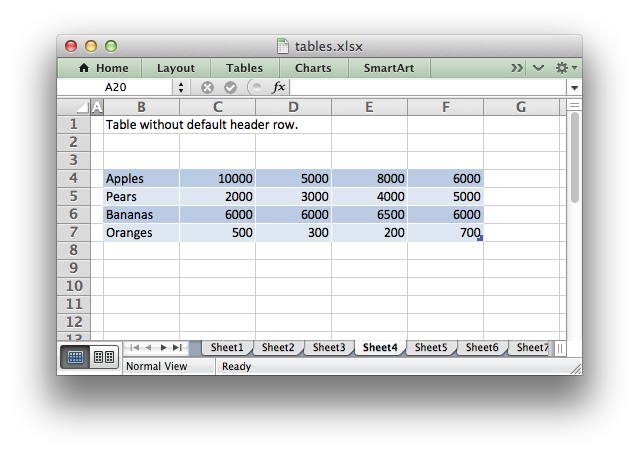
The header row will contain default captions such as Column 1,
Column 2, etc. These captions can be overridden using the columns
parameter below.
autofilter#
The autofilter parameter can be used to turn on or off the autofilter in
the header row. It is on by default:
# Turn off the default autofilter.
worksheet.add_table('B3:F7', {'autofilter': False})

The autofilter is only shown if the header_row is on. Filter conditions
within the table are not supported.
banded_rows#
The banded_rows parameter can be used to create rows of alternating color
in the table. It is on by default:
# Turn off banded rows.
worksheet.add_table('B3:F7', {'banded_rows': False})
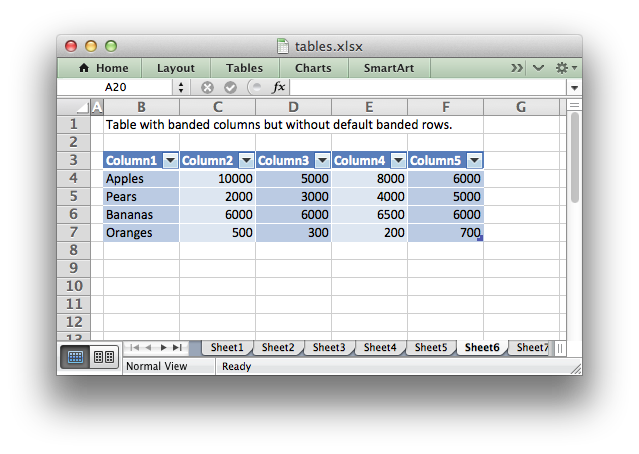
banded_columns#
The banded_columns parameter can be used to used to create columns of
alternating color in the table. It is off by default:
# Turn on banded columns.
worksheet.add_table('B3:F7', {'banded_columns': True})
See the above image.
first_column#
The first_column parameter can be used to highlight the first column of the
table. The type of highlighting will depend on the style of the table. It
may be bold text or a different color. It is off by default:
# Turn on highlighting for the first column in the table.
worksheet.add_table('B3:F7', {'first_column': True})
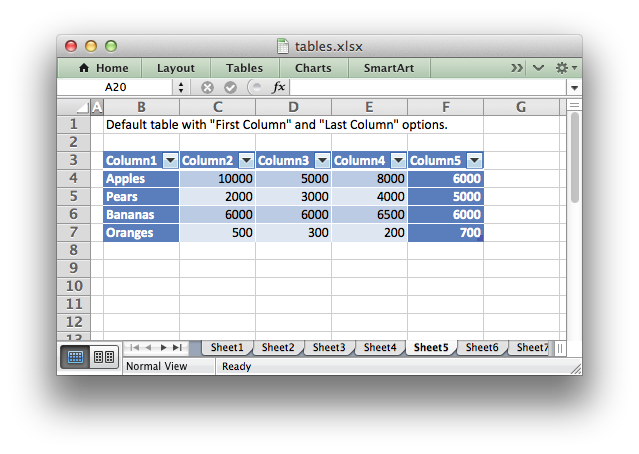
last_column#
The last_column parameter can be used to highlight the last column of the
table. The type of highlighting will depend on the style of the table. It
may be bold text or a different color. It is off by default:
# Turn on highlighting for the last column in the table.
worksheet.add_table('B3:F7', {'last_column': True})
See the above image.
style#
The style parameter can be used to set the style of the table. Standard
Excel table format names should be used (with matching capitalization):
worksheet.add_table('B3:F7', {'data': data,
                              'style': 'Table Style Light 11'})
The default table style is ‘Table Style Medium 9’.
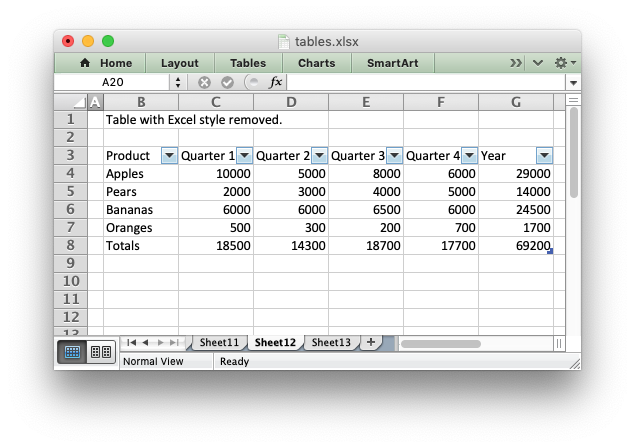
You can also turn the table style off by setting it to None:
worksheet.add_table('B3:F7', {'data': data, 'style': None})
name#
By default tables are named Table1, Table2, etc. The name
parameter can be used to set the name of the table:
worksheet.add_table('B3:F7', {'name': 'SalesData'})
If you override the table name you must ensure that it doesn’t clash with an existing table name and that it follows Excel’s requirements for table names, see the Microsoft Office documentation.
total_row#
The total_row parameter can be used to turn on the total row in the last
row of a table. It is distinguished from the other rows by a different
formatting and also with dropdown SUBTOTAL functions:
worksheet.add_table('B3:F7', {'total_row': True})
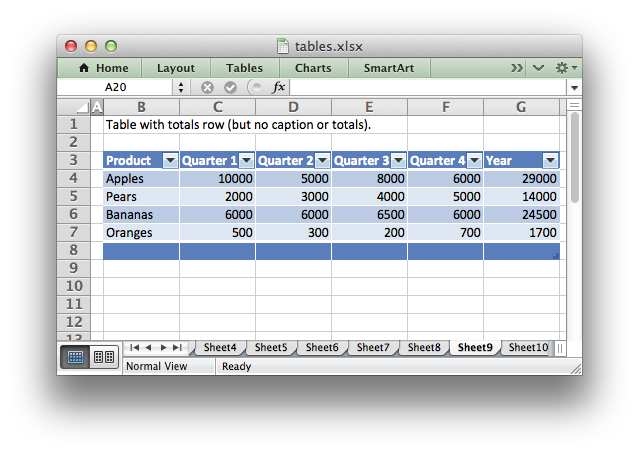
The default total row doesn’t have any captions or functions. These must by
specified via the columns parameter below.
columns#
The columns parameter can be used to set properties for columns within the
table.
The sub-properties that can be set are:
header |
header_format |
formula |
total_string |
total_function |
total_value |
format |
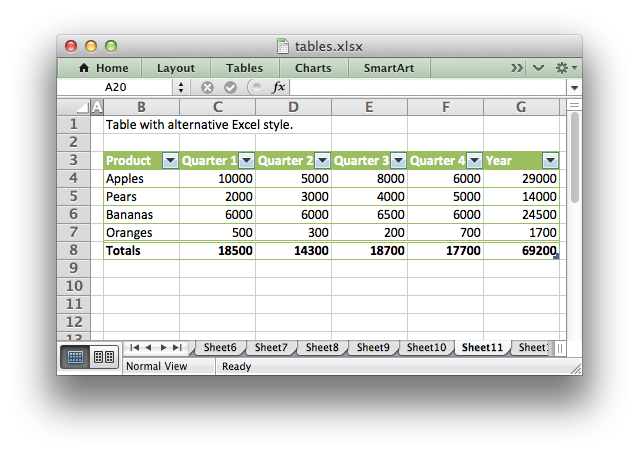
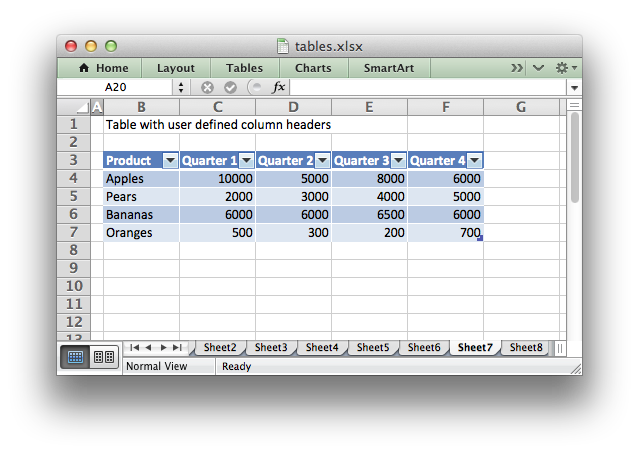
The column data must be specified as a list of dicts. For example to override the default ‘Column n’ style table headers:
worksheet.add_table('B3:F7', {'data': data,
                              'columns': [{'header': 'Product'},
                                          {'header': 'Quarter 1'},
                                          {'header': 'Quarter 2'},
                                          {'header': 'Quarter 3'},
                                          {'header': 'Quarter 4'},
                                          ]})
See the resulting image above.
If you don’t wish to specify properties for a specific column you pass an empty hash ref and the defaults will be applied:
...
columns, [
    {header, 'Product'},
    {header, 'Quarter 1'},
    {},                     # Defaults to 'Column 3'.
    {header, 'Quarter 3'},
    {header, 'Quarter 4'},
]
...
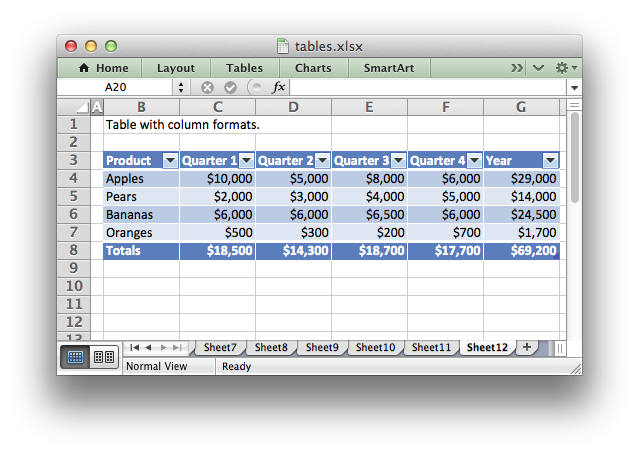
Column formulas can by applied using the column formula property:
formula = '=SUM(Table8[@[Quarter 1]:[Quarter 4]])'

worksheet.add_table('B3:G7', {'data': data,
                              'columns': [{'header': 'Product'},
                                          {'header': 'Quarter 1'},
                                          {'header': 'Quarter 2'},
                                          {'header': 'Quarter 3'},
                                          {'header': 'Quarter 4'},
                                          {'header': 'Year',
                                           'formula': formula},
                                          ]})
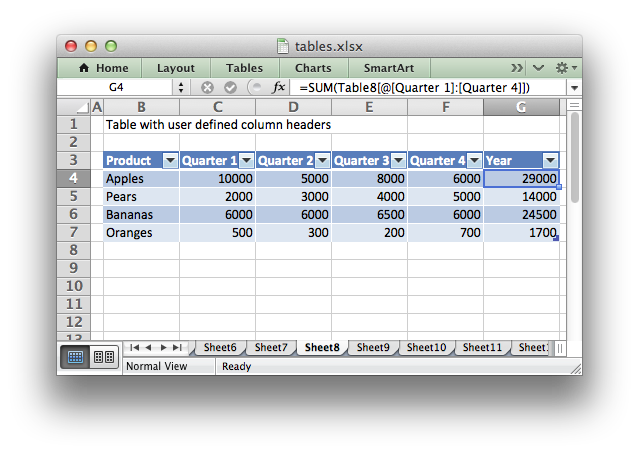
The Excel 2007 style [#This Row] and Excel 2010 style @ structural
references are supported within the formula. However, other Excel 2010
additions to structural references aren’t supported and formulas should
conform to Excel 2007 style formulas. See the Microsoft documentation on
Using structured references with Excel tables
for details.
As stated above the total_row table parameter turns on the “Total” row in
the table but it doesn’t populate it with any defaults. Total captions and
functions must be specified via the columns property and the
total_string and total_function sub properties:
options = {'data': data,
           'total_row': 1,
           'columns': [{'header': 'Product', 'total_string': 'Totals'},
                       {'header': 'Quarter 1', 'total_function': 'sum'},
                       {'header': 'Quarter 2', 'total_function': 'sum'},
                       {'header': 'Quarter 3', 'total_function': 'sum'},
                       {'header': 'Quarter 4', 'total_function': 'sum'},
                       {'header': 'Year',
                        'formula': '=SUM(Table10[@[Quarter 1]:[Quarter 4]])',
                        'total_function': 'sum'
                        },
                       ]}

# Add a table to the worksheet.
worksheet.add_table('B3:G8', options)
The supported totals row SUBTOTAL functions are:
average |
count_nums |
count |
max |
min |
std_dev |
sum |
var |
User defined functions or formulas can also be added.
It is also possible to set a calculated value for the total_function using
the total_value sub property. This is only necessary when creating
workbooks for applications that cannot calculate the value of formulas
automatically. This is similar to setting the value optional property in
write_formula():
options = {'data': data,
           'total_row': 1,
           'columns': [{'total_string': 'Totals'},
                       {'total_function': 'sum', 'total_value': 150},
                       {'total_function': 'sum', 'total_value': 200},
                       {'total_function': 'sum', 'total_value': 333},
                       {'total_function': 'sum', 'total_value': 124},
                       {'formula': '=SUM(Table10[@[Quarter 1]:[Quarter 4]])',
                        'total_function': 'sum',
                        'total_value': 807}]}
Formatting can also be applied to columns, to the column data using format and to the header using header_format:
currency_format = workbook.add_format({'num_format': '$#,##0'})
wrap_format     = workbook.add_format({'text_wrap': 1})

worksheet.add_table('B3:D8', {'data': data,
                              'total_row': 1,
                              'columns': [{'header': 'Product'},
                                          {'header': 'Quarter 1',
                                           'total_function': 'sum',
                                           'format': currency_format},
                                          {'header': 'Quarter 2',
                                           'header_format': wrap_format,
                                           'total_function': 'sum',
                                           'format': currency_format}]})
Standard XlsxWriter Format object objects are used for this formatting. However, they should be limited to numerical formats for the columns and simple formatting like text wrap for the headers. Overriding other table formatting may produce inconsistent results.
Example#
All of the images shown above are taken from Example: Worksheet Tables.