Example: Sparklines (Simple)#
Example of how to add sparklines to a XlsxWriter worksheet.
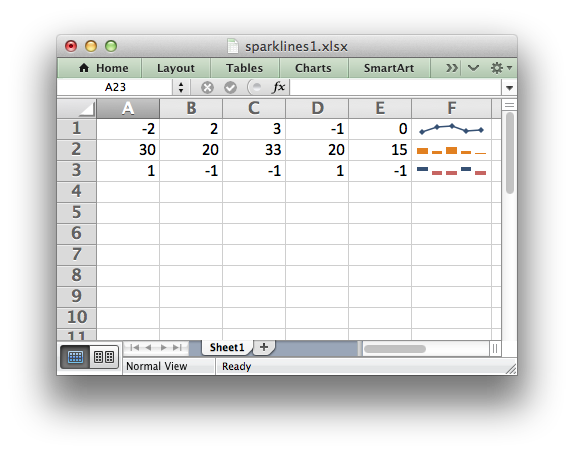
Sparklines are small charts that fit in a single cell and are used to show trends in data.
See the Working with Sparklines method for more details.
###############################################################################
#
# Example of how to add sparklines to a Python XlsxWriter file.
#
# Sparklines are small charts that fit in a single cell and are
# used to show trends in data.
#
# See sparklines2.py for examples of more complex sparkline formatting.
#
# SPDX-License-Identifier: BSD-2-Clause
#
# Copyright (c) 2013-2025, John McNamara, jmcnamara@cpan.org
#
import xlsxwriter

workbook = xlsxwriter.Workbook("sparklines1.xlsx")
worksheet = workbook.add_worksheet()

# Some sample data to plot.
data = [
    [-2, 2, 3, -1, 0],
    [30, 20, 33, 20, 15],
    [1, -1, -1, 1, -1],
]


# Write the sample data to the worksheet.
worksheet.write_row("A1", data[0])
worksheet.write_row("A2", data[1])
worksheet.write_row("A3", data[2])


# Add a line sparkline (the default) with markers.
worksheet.add_sparkline("F1", {"range": "Sheet1!A1:E1", "markers": True})


# Add a column sparkline with non-default style.
worksheet.add_sparkline("F2", {"range": "Sheet1!A2:E2", "type": "column", "style": 12})


# Add a win/loss sparkline with negative values highlighted.
worksheet.add_sparkline(
    "F3", {"range": "Sheet1!A3:E3", "type": "win_loss", "negative_points": True}
)

workbook.close()