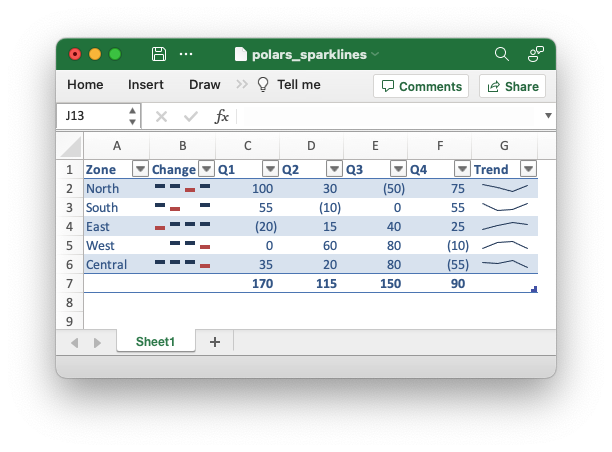
Example: Polars Excel output with sparklines#
An example of adding a sparklines to the output of a Polars dataframe. See Working with Polars and XlsxWriter for more details.
##############################################################################
#
# An example of writing multiple dataframes to worksheets using Polars and
# XlsxWriter.
#
# SPDX-License-Identifier: BSD-2-Clause
#
# Copyright (c) 2013-2025, John McNamara, jmcnamara@cpan.org
#

import polars as pl

df = pl.DataFrame(
    {
        "Zone": ["North", "South", "East", "West", "Central"],
        "Q1": [100, 55, -20, 0, 35],
        "Q2": [30, -10, 15, 60, 20],
        "Q3": [-50, 0, 40, 80, 80],
        "Q4": [75, 55, 25, -10, -55],
    }
)

# Write the dataframe with sparklines and some additional formatting.
df.write_excel(
    workbook="polars_sparklines.xlsx",
    # Set an alternative table style.
    table_style="Table Style Light 2",
    # Specify an Excel number format for integer types.
    dtype_formats={pl.Int32: "#,##0_);(#,##0)"},
    # Configure sparklines to the dataframe.
    sparklines={
        # We use the default options with just  the source columns.
        "Trend": ["Q1", "Q2", "Q3", "Q4"],
        # We also add a customized sparkline type, with a positioning directive.
        "Change": {
            "columns": ["Q1", "Q2", "Q3", "Q4"],
            "insert_after": "Zone",
            "type": "win_loss",
        },
    },
    column_totals=["Q1", "Q2", "Q3", "Q4"],
    # Hide the default gridlines on the worksheet.
    hide_gridlines=True,
)