Example: Date Axis Chart#
Date Category Axes are a special case of Category axes in Excel which give them some of the properties of Values axes.
For example, Excel doesn’t normally allow minimum and maximum values to be set for category axes. However, date axes are an exception.
In XlsxWriter Date Category Axes are set using the date_axis option in
set_x_axis() or set_y_axis():
chart.set_x_axis({'date_axis': True})
If used, the min and max values should be set as Excel times or dates.
#######################################################################
#
# An example of creating an Excel charts with a date axis using
# Python and XlsxWriter.
#
# SPDX-License-Identifier: BSD-2-Clause
#
# Copyright (c) 2013-2025, John McNamara, jmcnamara@cpan.org
#
from datetime import date
import xlsxwriter
workbook = xlsxwriter.Workbook("chart_date_axis.xlsx")
worksheet = workbook.add_worksheet()
chart = workbook.add_chart({"type": "line"})
date_format = workbook.add_format({"num_format": "dd/mm/yyyy"})
# Widen the first column to display the dates.
worksheet.set_column("A:A", 12)
# Some data to be plotted in the worksheet.
dates = [
date(2013, 1, 1),
date(2013, 1, 2),
date(2013, 1, 3),
date(2013, 1, 4),
date(2013, 1, 5),
date(2013, 1, 6),
date(2013, 1, 7),
date(2013, 1, 8),
date(2013, 1, 9),
date(2013, 1, 10),
]
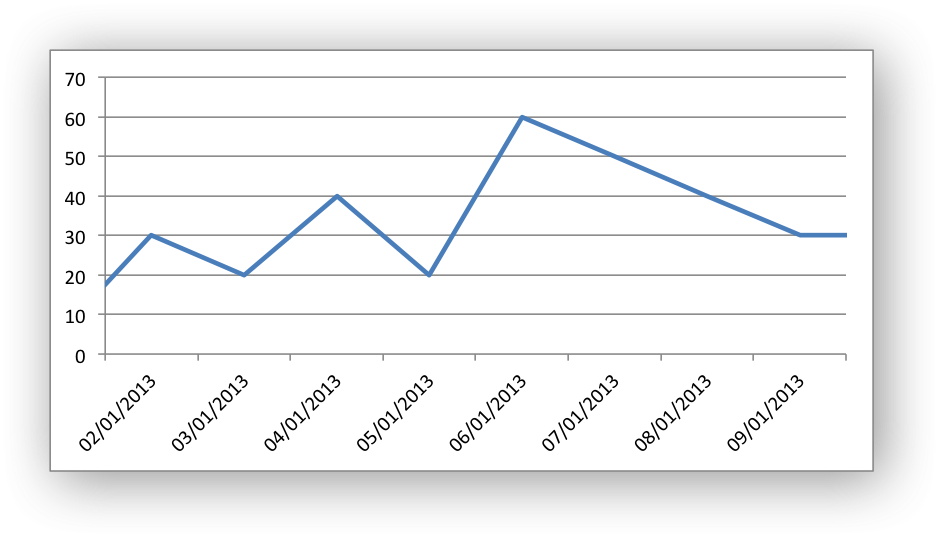
values = [10, 30, 20, 40, 20, 60, 50, 40, 30, 30]
# Write the date to the worksheet.
worksheet.write_column("A1", dates, date_format)
worksheet.write_column("B1", values)
# Add a series to the chart.
chart.add_series(
{
"categories": "=Sheet1!$A$1:$A$10",
"values": "=Sheet1!$B$1:$B$10",
}
)
# Configure the X axis as a Date axis and set the max and min limits.
chart.set_x_axis(
{
"date_axis": True,
"min": date(2013, 1, 2),
"max": date(2013, 1, 9),
}
)
# Turn off the legend.
chart.set_legend({"none": True})
# Insert the chart into the worksheet.
worksheet.insert_chart("D2", chart)
workbook.close()