Example: Pie Chart#
Example of creating Excel Pie charts. Chart 1 in the following example is:
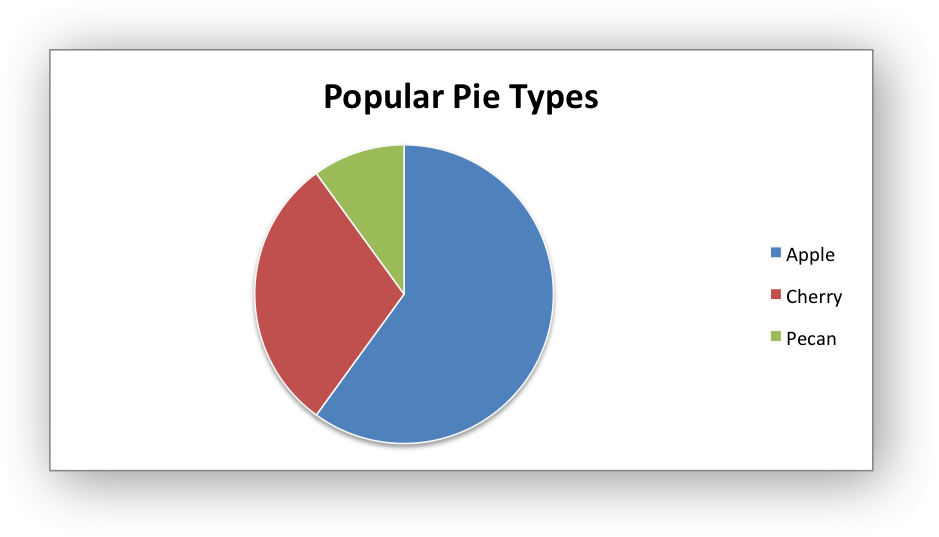
Chart 2 shows how to set segment colors.
It is possible to define chart colors for most types of XlsxWriter charts via
the add_series() method. However, Pie charts are a special case since
each segment is represented as a point and as such it is necessary to assign
formatting to each point in the series.
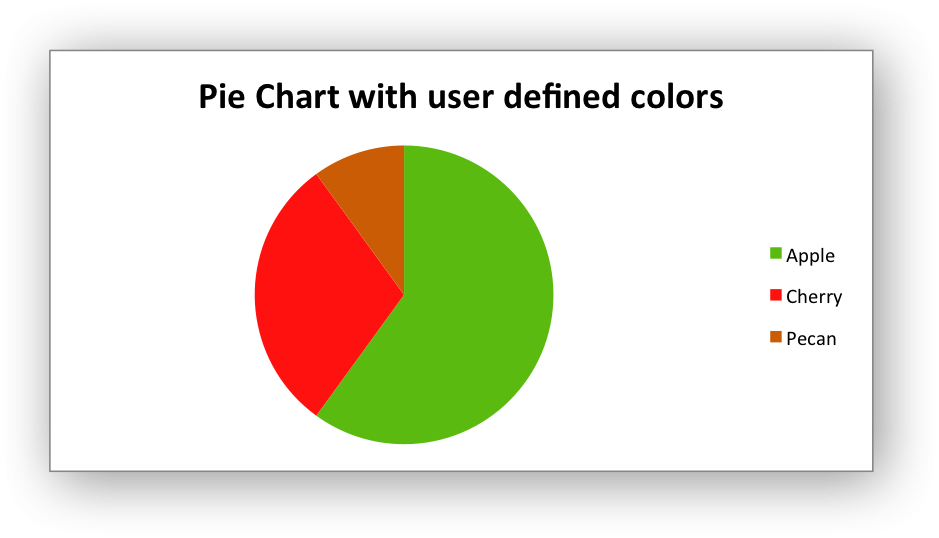
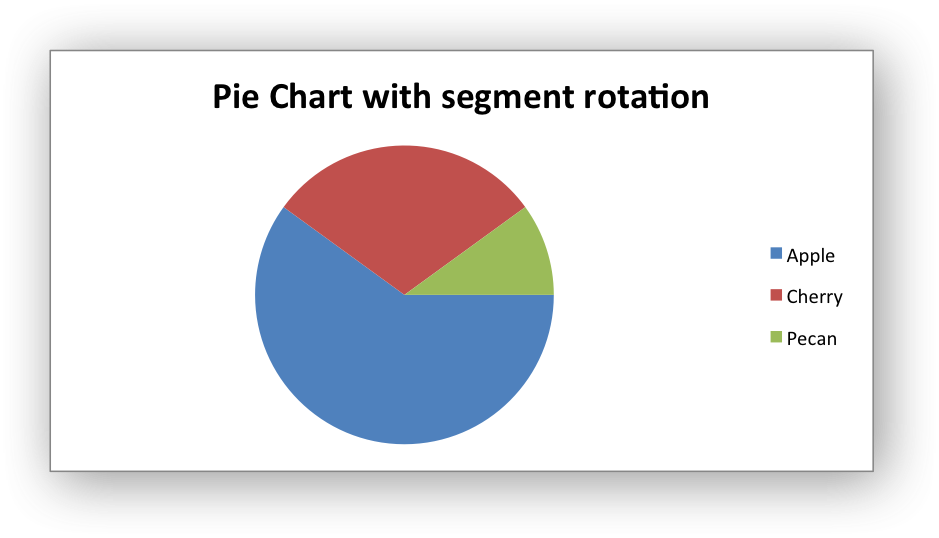
Chart 3 shows how to rotate the segments of the chart:
#######################################################################
#
# An example of creating Excel Pie charts with Python and XlsxWriter.
#
# The demo also shows how to set segment colors. It is possible to
# define chart colors for most types of XlsxWriter charts
# via the add_series() method. However, Pie/Doughnut charts are a special
# case since each segment is represented as a point so it is necessary to
# assign formatting to each point in the series.
#
# SPDX-License-Identifier: BSD-2-Clause
#
# Copyright (c) 2013-2025, John McNamara, jmcnamara@cpan.org
#
import xlsxwriter

workbook = xlsxwriter.Workbook("chart_pie.xlsx")

worksheet = workbook.add_worksheet()
bold = workbook.add_format({"bold": 1})

# Add the worksheet data that the charts will refer to.
headings = ["Category", "Values"]
data = [
    ["Apple", "Cherry", "Pecan"],
    [60, 30, 10],
]

worksheet.write_row("A1", headings, bold)
worksheet.write_column("A2", data[0])
worksheet.write_column("B2", data[1])

#######################################################################
#
# Create a new chart object.
#
chart1 = workbook.add_chart({"type": "pie"})

# Configure the series. Note the use of the list syntax to define ranges:
chart1.add_series(
    {
        "name": "Pie sales data",
        "categories": ["Sheet1", 1, 0, 3, 0],
        "values": ["Sheet1", 1, 1, 3, 1],
    }
)

# Add a title.
chart1.set_title({"name": "Popular Pie Types"})

# Set an Excel chart style. Colors with white outline and shadow.
chart1.set_style(10)

# Insert the chart into the worksheet (with an offset).
worksheet.insert_chart("C2", chart1, {"x_offset": 25, "y_offset": 10})

#######################################################################
#
# Create a Pie chart with user defined segment colors.
#

# Create an example Pie chart like above.
chart2 = workbook.add_chart({"type": "pie"})

# Configure the series and add user defined segment colors.
chart2.add_series(
    {
        "name": "Pie sales data",
        "categories": "=Sheet1!$A$2:$A$4",
        "values": "=Sheet1!$B$2:$B$4",
        "points": [
            {"fill": {"color": "#5ABA10"}},
            {"fill": {"color": "#FE110E"}},
            {"fill": {"color": "#CA5C05"}},
        ],
    }
)

# Add a title.
chart2.set_title({"name": "Pie Chart with user defined colors"})

# Insert the chart into the worksheet (with an offset).
worksheet.insert_chart("C18", chart2, {"x_offset": 25, "y_offset": 10})

#######################################################################
#
# Create a Pie chart with rotation of the segments.
#

# Create an example Pie chart like above.
chart3 = workbook.add_chart({"type": "pie"})

# Configure the series.
chart3.add_series(
    {
        "name": "Pie sales data",
        "categories": "=Sheet1!$A$2:$A$4",
        "values": "=Sheet1!$B$2:$B$4",
    }
)

# Add a title.
chart3.set_title({"name": "Pie Chart with segment rotation"})

# Change the angle/rotation of the first segment.
chart3.set_rotation(90)

# Insert the chart into the worksheet (with an offset).
worksheet.insert_chart("C34", chart3, {"x_offset": 25, "y_offset": 10})

workbook.close()