Example: Styles Chart#
An example showing all 48 default chart styles available in Excel 2007 using
the chart set_style() method.
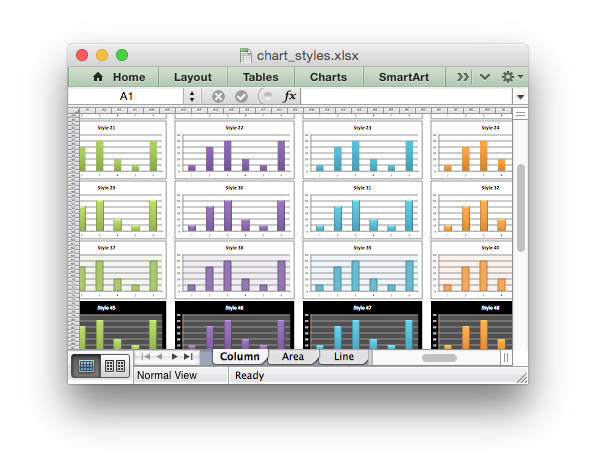
Note, these styles are not the same as the styles available in Excel 2013.
#######################################################################
#
# An example showing all 48 default chart styles available in Excel 2007
# using Python and XlsxWriter. Note, these styles are not the same as
# the styles available in Excel 2013.
#
# SPDX-License-Identifier: BSD-2-Clause
#
# Copyright (c) 2013-2025, John McNamara, jmcnamara@cpan.org
#
import xlsxwriter

workbook = xlsxwriter.Workbook("chart_styles.xlsx")

# Show the styles for all of these chart types.
chart_types = ["column", "area", "line", "pie"]

for chart_type in chart_types:
    # Add a worksheet for each chart type.
    worksheet = workbook.add_worksheet(chart_type.title())
    worksheet.set_zoom(30)
    style_number = 1

    # Create 48 charts, each with a different style.
    for row_num in range(0, 90, 15):
        for col_num in range(0, 64, 8):
            chart = workbook.add_chart({"type": chart_type})
            chart.add_series({"values": "=Data!$A$1:$A$6"})
            chart.set_title({"name": f"Style {style_number}"})
            chart.set_legend({"none": True})
            chart.set_style(style_number)

            worksheet.insert_chart(row_num, col_num, chart)
            style_number += 1

# Create a worksheet with data for the charts.
data_worksheet = workbook.add_worksheet("Data")
data = [10, 40, 50, 20, 10, 50]
data_worksheet.write_column("A1", data)
data_worksheet.hide()

workbook.close()