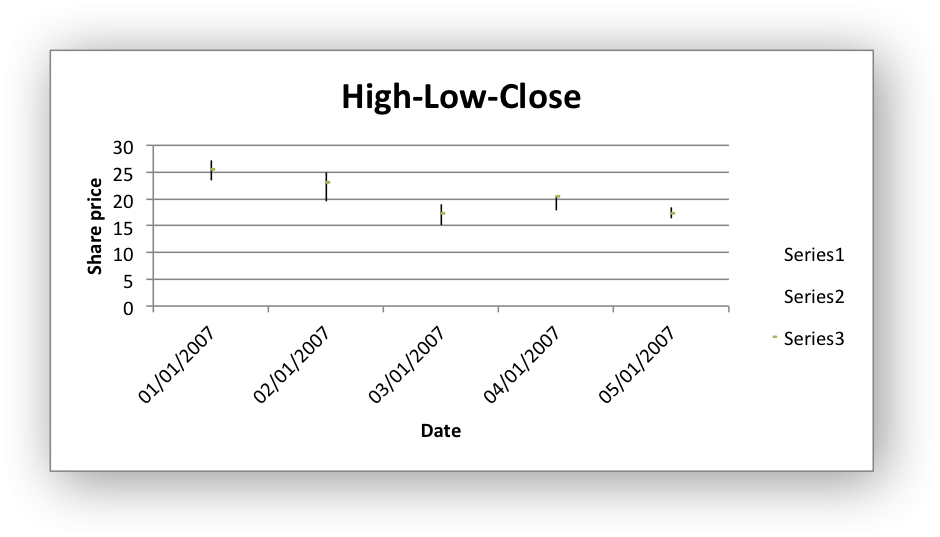
Example: Stock Chart#
Example of creating and Excel HiLow-Close Stock chart.
Chart 1 in the following example is:
#######################################################################
#
# An example of creating Excel Stock charts with Python and XlsxWriter.
#
# SPDX-License-Identifier: BSD-2-Clause
#
# Copyright (c) 2013-2025, John McNamara, jmcnamara@cpan.org
#
from datetime import datetime

import xlsxwriter

workbook = xlsxwriter.Workbook("chart_stock.xlsx")
worksheet = workbook.add_worksheet()

bold = workbook.add_format({"bold": 1})
date_format = workbook.add_format({"num_format": "dd/mm/yyyy"})

chart = workbook.add_chart({"type": "stock"})

# Add the worksheet data that the charts will refer to.
headings = ["Date", "High", "Low", "Close"]
data = [
    ["2007-01-01", "2007-01-02", "2007-01-03", "2007-01-04", "2007-01-05"],
    [27.2, 25.03, 19.05, 20.34, 18.5],
    [23.49, 19.55, 15.12, 17.84, 16.34],
    [25.45, 23.05, 17.32, 20.45, 17.34],
]

worksheet.write_row("A1", headings, bold)

for row in range(5):
    date = datetime.strptime(data[0][row], "%Y-%m-%d")

    worksheet.write(row + 1, 0, date, date_format)
    worksheet.write(row + 1, 1, data[1][row])
    worksheet.write(row + 1, 2, data[2][row])
    worksheet.write(row + 1, 3, data[3][row])

worksheet.set_column("A:D", 11)

# Add a series for each of the High-Low-Close columns.
chart.add_series(
    {
        "categories": "=Sheet1!$A$2:$A$6",
        "values": "=Sheet1!$B$2:$B$6",
    }
)

chart.add_series(
    {
        "categories": "=Sheet1!$A$2:$A$6",
        "values": "=Sheet1!$C$2:$C$6",
    }
)

chart.add_series(
    {
        "categories": "=Sheet1!$A$2:$A$6",
        "values": "=Sheet1!$D$2:$D$6",
    }
)

# Add a chart title and some axis labels.
chart.set_title({"name": "High-Low-Close"})
chart.set_x_axis({"name": "Date"})
chart.set_y_axis({"name": "Share price"})

worksheet.insert_chart("E9", chart)

workbook.close()