Example: Charts with Data Labels#
A demo of some of the Excel chart data labels options that are available via an XlsxWriter chart. These include custom labels with user text or text taken from cells in the worksheet. See also Chart series option: Data Labels and Chart series option: Custom Data Labels.
Chart 1 in the following example is a chart with standard data labels:
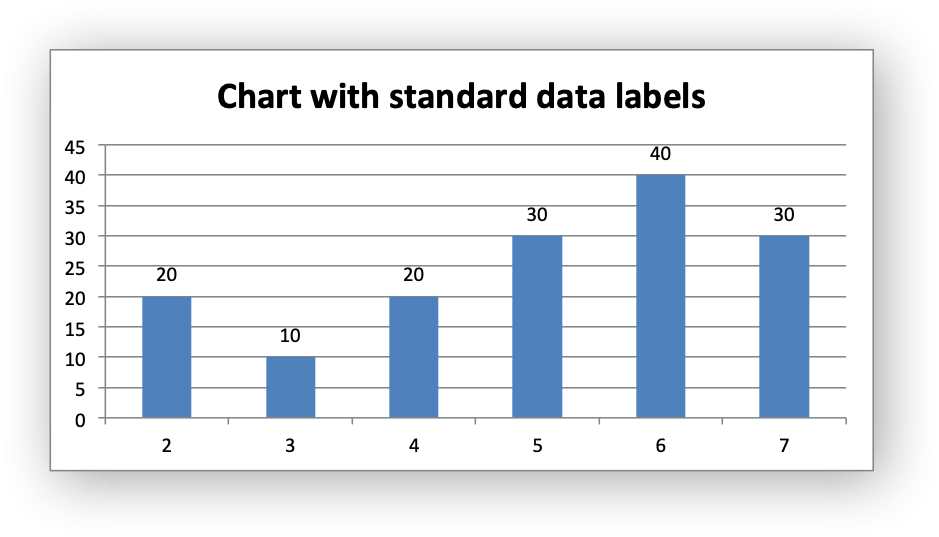
Chart 2 is a chart with Category and Value data labels:
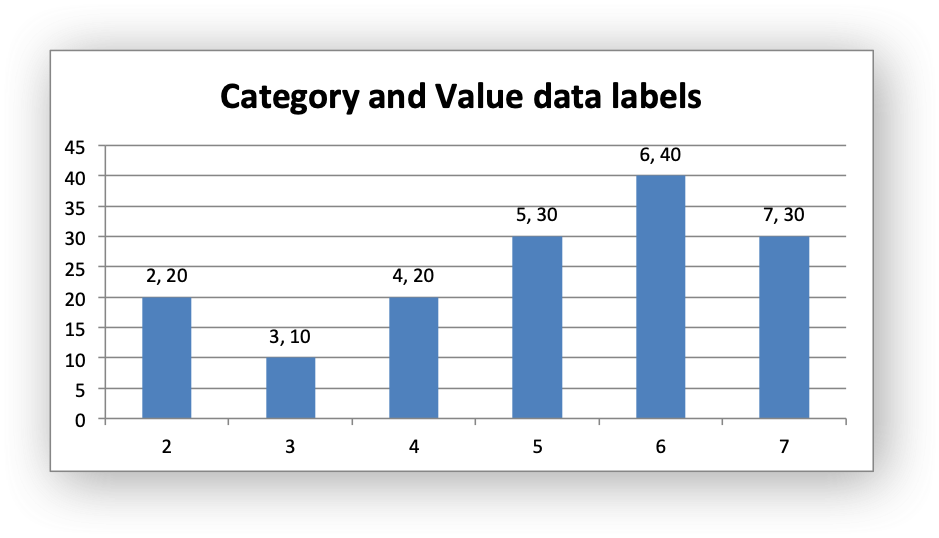
Chart 3 is a chart with data labels with a user defined font:

Chart 4 is a chart with standard data labels and formatting:

Chart 5 is a chart with custom string data labels:

Chart 6 is a chart with custom data labels referenced from worksheet cells:
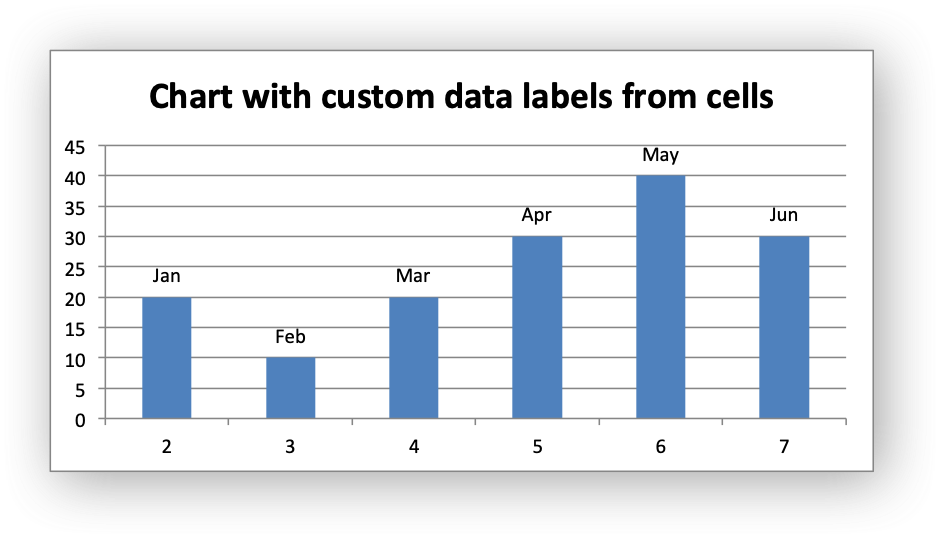
Chart 7 is a chart with a mix of custom and default labels. The None items
will get the default value. We also set a font for the custom items as an
extra example:
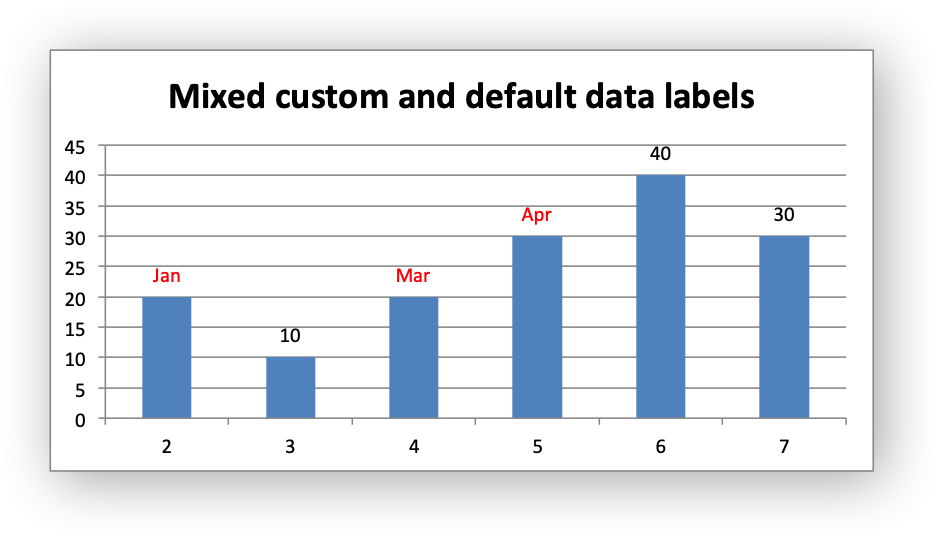
Chart 8 is a chart with some deleted custom labels and defaults (set with
None values). This allows us to highlight certain values such as the
minimum and maximum:
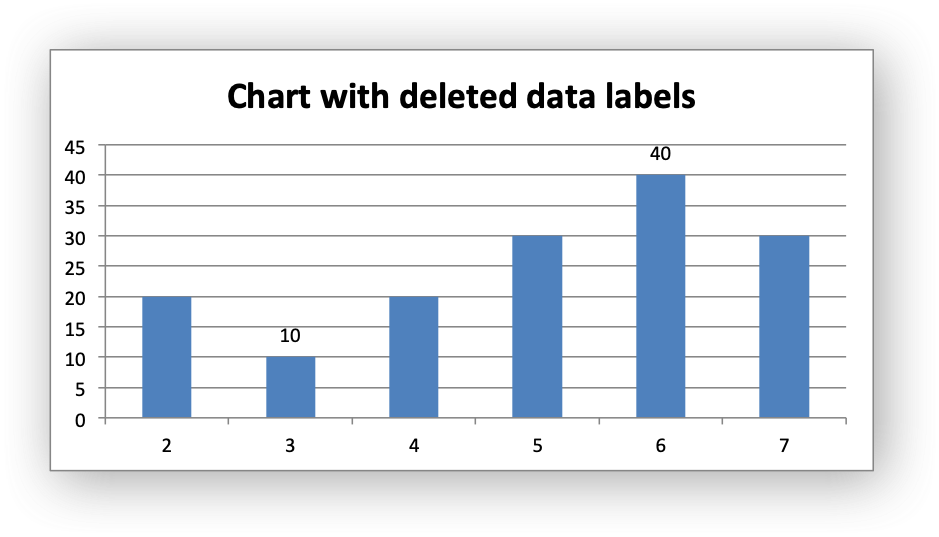
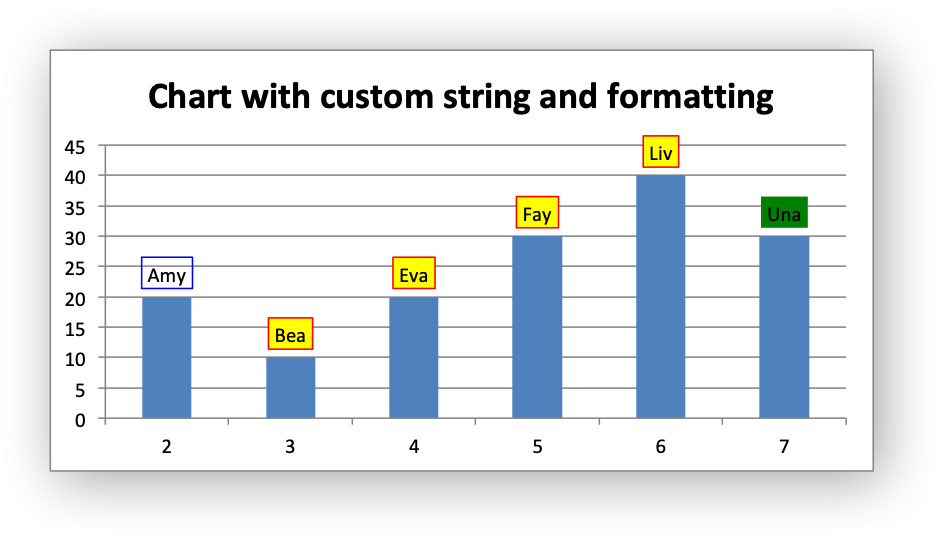
Chart 9 is a chart with custom string data labels and formatting:
#######################################################################
#
# A demo of an various Excel chart data label features that are available
# via an XlsxWriter chart.
#
# SPDX-License-Identifier: BSD-2-Clause
#
# Copyright (c) 2013-2025, John McNamara, jmcnamara@cpan.org
#
import xlsxwriter

workbook = xlsxwriter.Workbook("chart_data_labels.xlsx")
worksheet = workbook.add_worksheet()
bold = workbook.add_format({"bold": 1})

# Add the worksheet data that the charts will refer to.
headings = ["Number", "Data", "Text"]

data = [
    [2, 3, 4, 5, 6, 7],
    [20, 10, 20, 30, 40, 30],
    ["Jan", "Feb", "Mar", "Apr", "May", "Jun"],
]

worksheet.write_row("A1", headings, bold)
worksheet.write_column("A2", data[0])
worksheet.write_column("B2", data[1])
worksheet.write_column("C2", data[2])

#######################################################################
#
# Example with standard data labels.
#

# Create a Column chart.
chart1 = workbook.add_chart({"type": "column"})

# Configure the data series and add the data labels.
chart1.add_series(
    {
        "categories": "=Sheet1!$A$2:$A$7",
        "values": "=Sheet1!$B$2:$B$7",
        "data_labels": {"value": True},
    }
)

# Add a chart title.
chart1.set_title({"name": "Chart with standard data labels"})

# Turn off the chart legend.
chart1.set_legend({"none": True})

# Insert the chart into the worksheet (with an offset).
worksheet.insert_chart("D2", chart1, {"x_offset": 25, "y_offset": 10})

#######################################################################
#
# Example with value and category data labels.
#

# Create a Column chart.
chart2 = workbook.add_chart({"type": "column"})

# Configure the data series and add the data labels.
chart2.add_series(
    {
        "categories": "=Sheet1!$A$2:$A$7",
        "values": "=Sheet1!$B$2:$B$7",
        "data_labels": {"value": True, "category": True},
    }
)

# Add a chart title.
chart2.set_title({"name": "Category and Value data labels"})

# Turn off the chart legend.
chart2.set_legend({"none": True})

# Insert the chart into the worksheet (with an offset).
worksheet.insert_chart("D18", chart2, {"x_offset": 25, "y_offset": 10})

#######################################################################
#
# Example with standard data labels with different font.
#

# Create a Column chart.
chart3 = workbook.add_chart({"type": "column"})

# Configure the data series and add the data labels.
chart3.add_series(
    {
        "categories": "=Sheet1!$A$2:$A$7",
        "values": "=Sheet1!$B$2:$B$7",
        "data_labels": {
            "value": True,
            "font": {"bold": True, "color": "red", "rotation": -30},
        },
    }
)

# Add a chart title.
chart3.set_title({"name": "Data labels with user defined font"})

# Turn off the chart legend.
chart3.set_legend({"none": True})

# Insert the chart into the worksheet (with an offset).
worksheet.insert_chart("D34", chart3, {"x_offset": 25, "y_offset": 10})

#######################################################################
#
# Example with standard data labels and formatting.
#

# Create a Column chart.
chart4 = workbook.add_chart({"type": "column"})

# Configure the data series and add the data labels.
chart4.add_series(
    {
        "categories": "=Sheet1!$A$2:$A$7",
        "values": "=Sheet1!$B$2:$B$7",
        "data_labels": {
            "value": True,
            "border": {"color": "red"},
            "fill": {"color": "yellow"},
        },
    }
)

# Add a chart title.
chart4.set_title({"name": "Data labels with formatting"})

# Turn off the chart legend.
chart4.set_legend({"none": True})

# Insert the chart into the worksheet (with an offset).
worksheet.insert_chart("D50", chart4, {"x_offset": 25, "y_offset": 10})

#######################################################################
#
# Example with custom string data labels.
#

# Create a Column chart.
chart5 = workbook.add_chart({"type": "column"})

# Some custom labels.
custom_labels = [
    {"value": "Amy"},
    {"value": "Bea"},
    {"value": "Eva"},
    {"value": "Fay"},
    {"value": "Liv"},
    {"value": "Una"},
]

# Configure the data series and add the data labels.
chart5.add_series(
    {
        "categories": "=Sheet1!$A$2:$A$7",
        "values": "=Sheet1!$B$2:$B$7",
        "data_labels": {"value": True, "custom": custom_labels},
    }
)

# Add a chart title.
chart5.set_title({"name": "Chart with custom string data labels"})

# Turn off the chart legend.
chart5.set_legend({"none": True})

# Insert the chart into the worksheet (with an offset).
worksheet.insert_chart("D66", chart5, {"x_offset": 25, "y_offset": 10})

#######################################################################
#
# Example with custom data labels from cells.
#

# Create a Column chart.
chart6 = workbook.add_chart({"type": "column"})

# Some custom labels.
custom_labels = [
    {"value": "=Sheet1!$C$2"},
    {"value": "=Sheet1!$C$3"},
    {"value": "=Sheet1!$C$4"},
    {"value": "=Sheet1!$C$5"},
    {"value": "=Sheet1!$C$6"},
    {"value": "=Sheet1!$C$7"},
]

# Configure the data series and add the data labels.
chart6.add_series(
    {
        "categories": "=Sheet1!$A$2:$A$7",
        "values": "=Sheet1!$B$2:$B$7",
        "data_labels": {"value": True, "custom": custom_labels},
    }
)

# Add a chart title.
chart6.set_title({"name": "Chart with custom data labels from cells"})

# Turn off the chart legend.
chart6.set_legend({"none": True})

# Insert the chart into the worksheet (with an offset).
worksheet.insert_chart("D82", chart6, {"x_offset": 25, "y_offset": 10})

#######################################################################
#
# Example with custom and default data labels.
#

# Create a Column chart.
chart7 = workbook.add_chart({"type": "column"})

# The following is used to get a mix of default and custom labels. The 'None'
# items will get the default value. We also set a font for the custom items
# as an extra example.
custom_labels = [
    {"value": "=Sheet1!$C$2", "font": {"color": "red"}},
    None,
    {"value": "=Sheet1!$C$4", "font": {"color": "red"}},
    {"value": "=Sheet1!$C$5", "font": {"color": "red"}},
]

# Configure the data series and add the data labels.
chart7.add_series(
    {
        "categories": "=Sheet1!$A$2:$A$7",
        "values": "=Sheet1!$B$2:$B$7",
        "data_labels": {"value": True, "custom": custom_labels},
    }
)

# Add a chart title.
chart7.set_title({"name": "Mixed custom and default data labels"})

# Turn off the chart legend.
chart7.set_legend({"none": True})

# Insert the chart into the worksheet (with an offset).
worksheet.insert_chart("D98", chart7, {"x_offset": 25, "y_offset": 10})


#######################################################################
#
# Example with deleted custom data labels.
#

# Create a Column chart.
chart8 = workbook.add_chart({"type": "column"})

# Some deleted custom labels and defaults (set with None values). This allows
# us to highlight certain values such as the minimum and maximum.
custom_labels = [
    {"delete": True},
    None,
    {"delete": True},
    {"delete": True},
    None,
    {"delete": True},
]

# Configure the data series and add the data labels.
chart8.add_series(
    {
        "categories": "=Sheet1!$A$2:$A$7",
        "values": "=Sheet1!$B$2:$B$7",
        "data_labels": {"value": True, "custom": custom_labels},
    }
)

# Add a chart title.
chart8.set_title({"name": "Chart with deleted data labels"})

# Turn off the chart legend.
chart8.set_legend({"none": True})

# Insert the chart into the worksheet (with an offset).
worksheet.insert_chart("D114", chart8, {"x_offset": 25, "y_offset": 10})

#######################################################################
#
# Example with custom string data labels and formatting.
#

# Create a Column chart.
chart9 = workbook.add_chart({"type": "column"})

# Some custom labels.
custom_labels = [
    {"value": "Amy", "border": {"color": "blue"}},
    {"value": "Bea"},
    {"value": "Eva"},
    {"value": "Fay"},
    {"value": "Liv"},
    {"value": "Una", "fill": {"color": "green"}},
]

# Configure the data series and add the data labels.
chart9.add_series(
    {
        "categories": "=Sheet1!$A$2:$A$7",
        "values": "=Sheet1!$B$2:$B$7",
        "data_labels": {
            "value": True,
            "custom": custom_labels,
            "border": {"color": "red"},
            "fill": {"color": "yellow"},
        },
    }
)

# Add a chart title.
chart9.set_title({"name": "Chart with custom labels and formatting"})

# Turn off the chart legend.
chart9.set_legend({"none": True})

# Insert the chart into the worksheet (with an offset).
worksheet.insert_chart("D130", chart9, {"x_offset": 25, "y_offset": 10})

workbook.close()